
Customer Retention Analytics Dashboard
2025-12-14
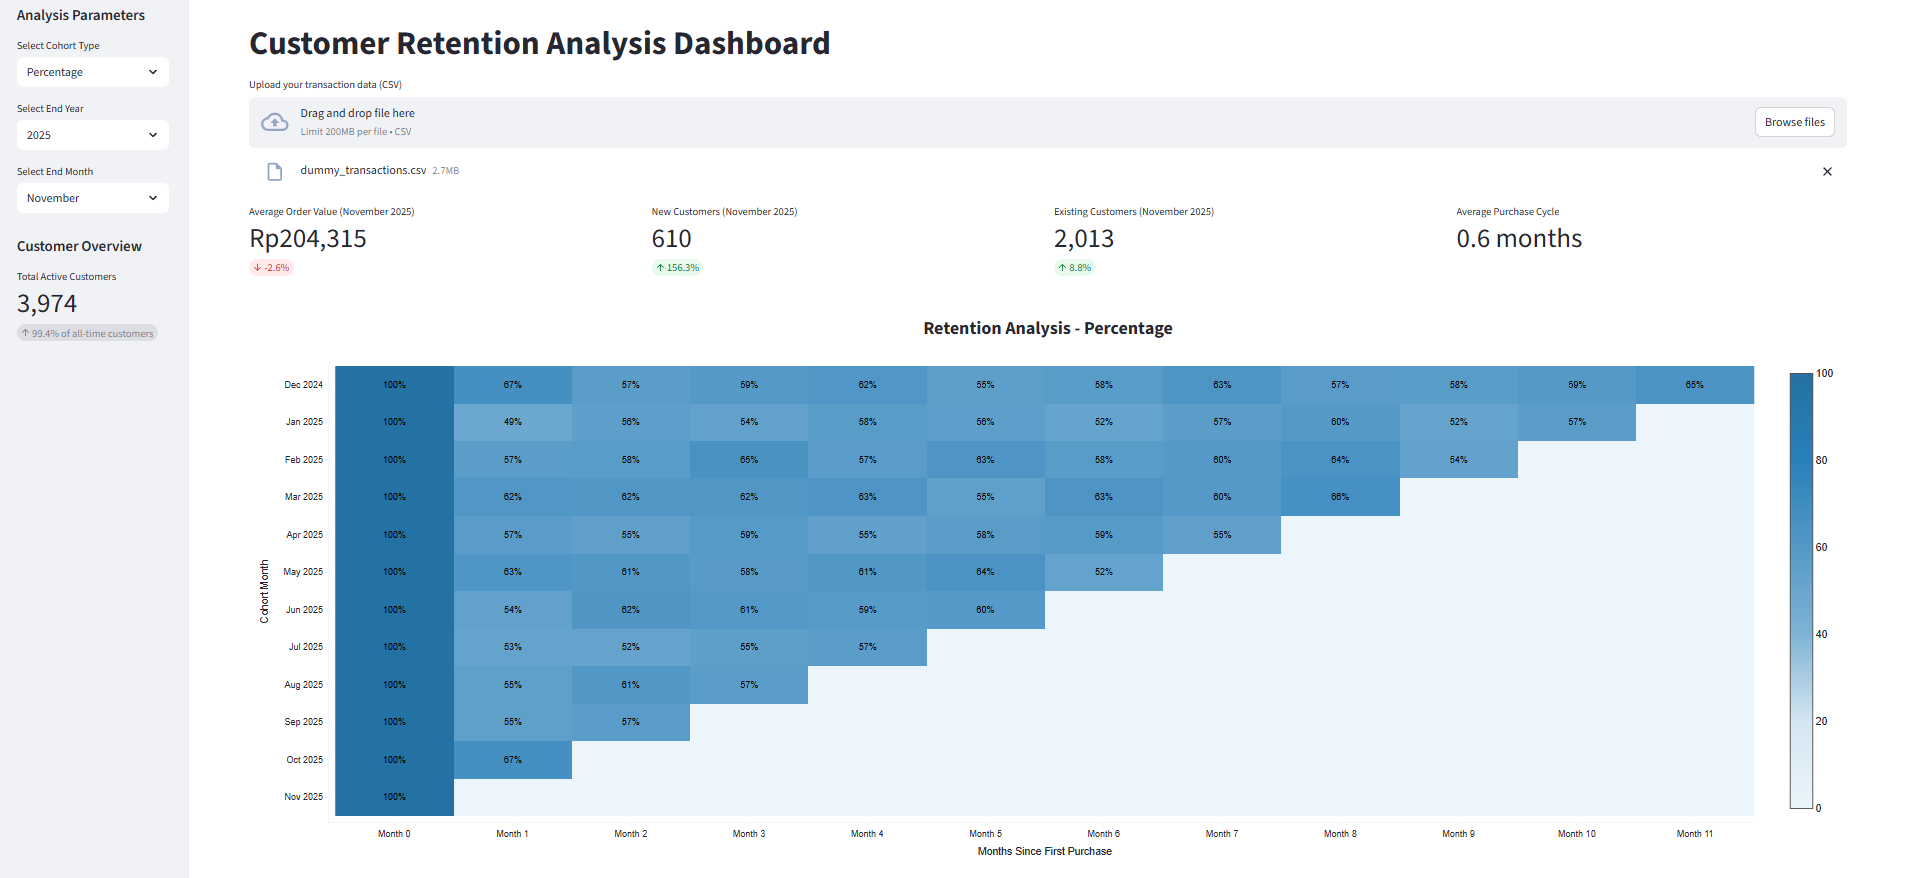
A Streamlit application for analyzing customer retention patterns using cohort analysis.
Features
- Multiple cohort analysis types:
- Unique Customers
- Percentage Retention
- Average Order Value (AOV)
- Flexible time period selection with yearly cutoffs
- Key metrics tracking:
- AOV with period-over-period comparison
- New customers per month with growth metrics
- Existing customers per month with growth metrics
- Interactive heatmap visualization
Required Data Format
The application expects a CSV file with the following columns:
transaction_datetime: Date of the transactiontransaction_id: Unique identifier for each transactioncustomer_id: Unique identifier for each customertransaction_value: Monetary value of the transaction
Setup
-
Create a virtual environment:
python -m venv venv -
Activate the virtual environment:
- Windows:
.\venv\Scripts\activate - Unix/MacOS:
source venv/bin/activate
- Windows:
-
Install dependencies:
pip install -r requirements.txt
Running the Application
-
Activate the virtual environment (if not already activated)
-
Run the Streamlit app:
streamlit run app.py -
Upload your CSV file and start analyzing!
Usage
- Upload your transaction data CSV file
- Select the cohort type (Unique Customers, Percentage, or AOV)
- Choose the start year and month for the analysis period
- Filter by customer ranks if desired
- Analyze the results in the interactive dashboard
The heatmap shows retention patterns over time, with darker colors indicating higher values. The metrics at the top show period-over-period comparisons for key business indicators.
If you don’t have real transaction data yet, this repo includes a notebook to generate a realistic dummy dataset for testing.
-
Make sure your virtual environment is activated and dependencies are installed.
pip install -r requirements.txt -
Open the notebook.
jupyter notebook -
Run all the cells. The notebook will generate a CSV file (e.g.
dummy_transactions.csv) in the project folder.